CANARA ROBECO SMALL CAP FUND (CRSCF)
Small Cap Fund -An open-ended equity scheme predominantly investing in small cap stocks.
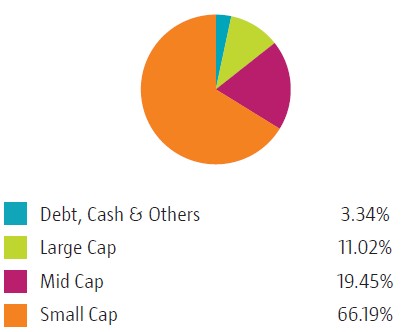
(as on August 29, 2025)
| SCHEME OBJECTIVE | To generate capital appreciation by investing predominantly in Small Cap stocks. However, there can be no assurance that the investment objective of the scheme will be realized. |
| DATE OF ALLOTMENT | February 15, 2019 |
| BENCHMARK | Nifty Smallcap 250 Index TRI |
| FUND MANAGER | 1) Mr. Pranav Gokhale 2) Mr. Shridatta Bhandwaldar |
| TOTAL EXPERIENCE | 1) 23 Years 2) 19 Years |
| MANAGING THIS FUND | 1)Since 06-Nov-23 2) Since 01-Oct-19 |
| ASSET ALLOCATION | Equity and Equity-related Instruments of Smallcap companies* 65% to 100% Equity and Equity-related Instruments of companies other than Smallcap companies 0% to 35% Debt and Money Market Instruments 0% to 35% Units issued by REITs and InvITs 0% to 10% *The investment universe of "Small Cap" shall comprise companies as defined by SEBI from time to time. For detailed asset allocation pattern, please refer the Scheme Information Document |
| MINIMUM INVESTMENT | Lump sum Investment: ₹ 5000 and in multiples of ₹ 1 thereafter Subsequent purchases: Minimum amount of ₹ 1000 and multiples of ₹ 1 thereafter Systematic Investment Plan (SIP): For Any date/monthly frequency – ₹ 1000 and in multiples of ₹ 1 thereafter For quarterly frequency – ₹ 2000 and in multiples of ₹ 1 thereafter Systematic Transfer Plan (STP): For Daily/Weekly/Monthly frequency – ₹ 1000 and in multiples of ₹ 1 thereafter For quarterly frequency – ₹ 2000 and in multiples of ₹ 1 thereafter Systematic Withdrawal Plan (SWP): For monthly frequency – ₹ 1000 and in multiples of ₹ 1 thereafter For quarterly frequency – ₹ 2000 and in multiples of ₹ 1 thereafter For Annual Frequency– ₹ 2,000 and in multiples of ₹ 1 thereafter |
| PLANS / OPTIONS | Regular Plan - Reinvestment of Income Distribution cum Capital Withdrawal Option Regular Plan - Payout of Income Distribution cum Capital Withdrawal Option Regular Plan - Growth Option Direct Plan - Reinvestment of Income Distribution cum Capital Withdrawal Option Direct Plan- Payout of Income Distribution cum Capital Withdrawal Option Direct Plan - Growth Option |
| EXIT LOAD | 1% - if Units are redeemed / switched-out within 1 year from the date of allotment. Nil – if redeemed / switched out after 1 year from the date of allotment. |
| EXPENSE RATIO^: |
Regular Plan : 1.68% Direct Plan : 0.47% |
| Month end Assets Under Management (AUM)# | ₹ 12,587.65 Crores |
| Monthly AVG Assets Under Management (AAUM) | ₹ 12,765.59 Crores |
| (as on August 29, 2025) | (₹) |
| Direct Plan - Growth Option | 41.5600 |
| Regular Plan - Growth Option | 37.5700 |
| Regular Plan - IDCW (payout/reinvestment | 32.1600 |
| Direct Plan - IDCW (payout/reinvestment) | 36.0000 |
| Standard Deviation | 15.89 |
| Portfolio Beta | 0.76 |
| Portfolio Turnover Ratio | 0.3 times |
| Sharpe Ratio | 0.62 |
| R-Squared | 0.94 |
| Name of the Instruments | % to NAV |
Equities |
96.66% |
Listed |
96.66% |
Consumer Durables |
9.24% |
Blue Star Ltd |
1.90% |
V-Guard Industries Ltd |
1.52% |
Amber Enterprises India Ltd |
1.44% |
Cera Sanitaryware Ltd |
1.34% |
Crompton Greaves Consumer Electricals Ltd |
1.16% |
Safari Industries (India) Ltd |
1.01% |
Greenply Industries Ltd |
0.73% |
Thangamayil Jewellery Ltd |
0.09% |
Greenlam Industries Ltd |
0.05% |
Capital Markets |
8.50% |
Multi Commodity Exchange Of India Ltd |
2.61% |
Computer Age Management Services Ltd |
1.48% |
Anand Rathi Wealth Ltd |
1.42% |
ICRA Ltd |
1.08% |
Indian Energy Exchange Ltd |
0.82% |
UTI Asset Management Co Ltd |
0.72% |
Prudent Corporate Advisory Services Ltd |
0.37% |
Pharmaceuticals & Biotechnology |
8.48% |
J.B. Chemicals & Pharmaceuticals Ltd |
1.85% |
Innova Captab Ltd |
1.17% |
Ajanta Pharma Ltd |
1.14% |
Gland Pharma Ltd |
1.13% |
Sun Pharmaceutical Industries Ltd |
1.11% |
Cohance Lifesciences Ltd |
1.10% |
Piramal Pharma Ltd |
0.98% |
Industrial Products |
7.33% |
KEI Industries Ltd |
2.37% |
EPL Ltd |
1.12% |
Ratnamani Metals & Tubes Ltd |
0.89% |
Subros Ltd |
0.76% |
Mold Tek Packaging Ltd |
0.68% |
Timken India Ltd |
0.56% |
Rhi Magnesita India Ltd |
0.52% |
Finolex Industries Ltd |
0.43% |
Banks |
7.02% |
Karur Vysya Bank Ltd |
2.00% |
City Union Bank Ltd |
1.80% |
Indian Bank |
1.16% |
Ujjivan Small Finance Bank Ltd |
1.11% |
Equitas Small Finance Bank Ltd |
0.95% |
Finance |
6.89% |
Cholamandalam Financial Holdings Ltd |
1.58% |
PNB Housing Finance Ltd |
1.22% |
Creditaccess Grameen Ltd |
1.18% |
Bajaj Finance Ltd |
1.04% |
Can Fin Homes Ltd |
0.98% |
Home First Finance Co India Ltd |
0.89% |
Leisure Services |
4.30% |
TBO Tek Ltd |
1.50% |
Indian Hotels Co Ltd |
1.21% |
Westlife Foodworld Ltd |
0.96% |
Devyani International Ltd |
0.63% |
Electrical Equipment |
3.72% |
Ge Vernova T&D India Ltd |
2.00% |
Triveni Turbine Ltd |
0.93% |
Apar Industries Ltd |
0.48% |
Hitachi Energy India Ltd |
0.31% |
Food Products |
3.67% |
EID Parry India Ltd |
1.71% |
Bikaji Foods International Ltd |
1.30% |
Mrs Bectors Food Specialities Ltd |
0.66% |
Healthcare Services |
3.54% |
Metropolis Healthcare Ltd |
1.25% |
Global Health Ltd |
1.21% |
Max Healthcare Institute Ltd |
1.08% |
Auto Components |
3.24% |
Schaeffler India Ltd |
1.15% |
Exide Industries Ltd |
1.03% |
CIE Automotive India Ltd |
0.60% |
Rolex Rings Ltd |
0.46% |
Retailing |
2.77% |
Eternal Ltd |
1.35% |
V-Mart Retail Ltd |
0.62% |
Go Fashion India Ltd |
0.41% |
Vedant Fashions Ltd |
0.39% |
IT - Services |
2.42% |
Affle 3i Ltd |
1.06% |
Cyient Ltd |
0.84% |
Sagility India Ltd |
0.52% |
IT - Software |
2.31% |
Tech Mahindra Ltd |
1.01% |
Birlasoft Ltd |
0.79% |
Latent View Analytics Ltd |
0.51% |
Transport Services |
2.19% |
Interglobe Aviation Ltd |
0.89% |
Great Eastern Shipping Co Ltd |
0.72% |
VRL Logistics Ltd |
0.58% |
Cement & Cement Products |
2.16% |
JK Lakshmi Cement Ltd |
1.20% |
The Ramco Cements Ltd |
0.96% |
Realty |
2.09% |
Sobha Ltd |
1.26% |
Brigade Enterprises Ltd |
0.83% |
Paper, Forest & Jute Products |
1.63% |
Aditya Birla Real Estate Ltd |
1.63% |
Industrial Manufacturing |
1.63% |
Jyoti CNC Automation Ltd |
0.78% |
GMM Pfaudler Ltd |
0.49% |
Praj Industries Ltd |
0.36% |
Aerospace & Defense |
1.62% |
Bharat Electronics Ltd |
1.62% |
Construction |
1.61% |
KEC International Ltd |
0.66% |
Ahluwalia Contracts (India) Ltd |
0.63% |
PNC Infratech Ltd |
0.32% |
Beverages |
1.40% |
Radico Khaitan Ltd |
1.40% |
Household Products |
1.27% |
Jyothy Labs Ltd |
0.84% |
Doms Industries Ltd |
0.43% |
Non - Ferrous Metals |
1.10% |
National Aluminium Co Ltd |
1.10% |
Power |
1.05% |
CESC Ltd |
1.05% |
Chemicals & Petrochemicals |
1.04% |
Rossari Biotech Ltd |
0.52% |
Fine Organic Industries Ltd |
0.29% |
NOCIL Ltd |
0.23% |
Commercial Services & Supplies |
0.89% |
Awfis Space Solutions Ltd |
0.89% |
Petroleum Products |
0.86% |
Reliance Industries Ltd |
0.86% |
Diversified Fmcg |
0.85% |
ITC Ltd |
0.85% |
Gas |
0.74% |
Mahanagar Gas Ltd |
0.74% |
Fertilizers & Agrochemicals |
0.59% |
Sumitomo Chemical India Ltd |
0.59% |
Textiles & Apparels |
0.51% |
K.P.R. Mill Ltd |
0.49% |
Arvind Ltd |
0.02% |
Money Market Instruments |
3.13% |
TREPS |
3.13% |
Net Current Assets |
0.21% |
GRAND TOTAL ( NET ASSET) |
100.00% |
| This product is suitable for investors who are seeking*: | |
|
|
 |
 Benchmark Riskometer (Nifty Smallcap 250 Index TRI) |
| *Investors should consult their financial advisers if in doubt about whether the product is suitable for them. | |
Source ICRA MFI Explorer | #Monthend AUM / Quantitative Information as on 29.08.2025 | ^The expense ratios mentioned for the schemes includes GST on investment management fees. Please click here for disclaimers.
The Scheme and Benchmark riskometers are evaluated on a monthly basis and
the above riskometers are based on the evaluation of the portfolios for the month
ended August 29, 2025.