Economic Indicators (as on August 29, 2025)
Inflation in India (%)
Consumer Price Index plummets to 8-year low of to 1.55% in Jul’25 from 2.1% in Jun’25, primarily driven byfalling prices of food items. Wholesale Price Index (WPI) decreased to 2-year low of-0.58% in Jul’25 from -0.13% in Jun’25 primarily attributed to a reduction in prices of food articles, mineral oils, manufacture of basic metals, crude petroleum & natural gas, etc.
Index of Industrial Production (%)
Index of Industrial Production (IIP) surged to 4-month high of 3.5% in Jul’25 from 1.5% in Jun’25. The growth was primarily driven by a 5.4% rise in manufacturing output, while electricity generation saw only a modest increase of 0.6% and mining production contracted by 7.2%.
Indian Business Indicators - Purchasing Managers' Index (PMI)
S&P Global India Manufacturing Purchasing Managers’ Index (PMI) increases to 59.3 in Aug’25 from 59.1 in Jul’25. This marks the fastest improvement in operating conditions in seventeen and a half years, with production growth accelerating to a nearly five-year high, supported by strong demand and better alignment of supply with orders. PMI Services reached a significant 15-year high of 65.6 in Aug’25 from 60.5 in Jul’25 driven by robust demand and strong international orders. The reading remains in the expansion zone, as a score above 50 indicates expansion, while a score below 50 denotes contraction.
USD INR & Brent Crude Movement
Brent crude oil decreased to US$ 68.12 on Aug’25 end from US$ 72.53 on Jul’25 due to growing concerns over a potential oversupply in the market. The Rupee closed the month on 88.2063 against Greenback as on Aug’25.
Equity Markets - India & US
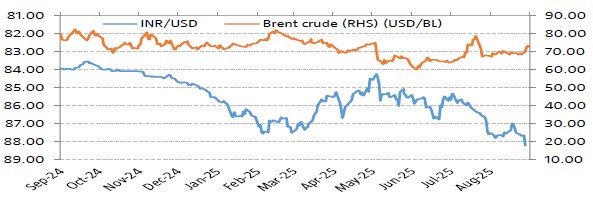
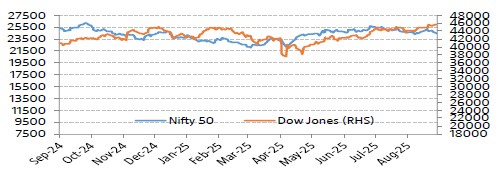
Bellwether indices, Nifty 50 and BSE Sensex moved down sharply during the month by 1.38% and 1.69% respectively due to signs of weakening earnings momentum among domestic companies in Q1FY26 and additional 25% tariff imposed by the U.S. President on India which came into effect on Aug 27, 2025. Investor sentiment weakened as the 50% tariff hike threatened India’s manufacturing push and could slow economic growth. Foreign Institutional Investors (FIIs) net sellers in Indian equities to the tune of ₹ 34993.16 crore. Gross Goods and Services Tax (GST) collections in Aug’25 stood at Rs. 1.86 trillion, representing a 6.5% rise on a yearly basis and this points towards the growing trajectory of the Indian economy. Dow Jones increased by 3.20% from previous month.
Interest Rate Movement (%) - India & US
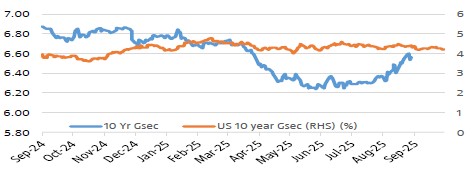
Yield on the 10-Year benchmark paper marginally increased, closing at 6.568% on Aug’25 vs 6.374% on Jul’25 as after announcement of sweeping changes to the Goods and Services Tax (GST) regime, reigniting fiscal concerns and heightening fears of increased debt supply. US 10 year G-Sec closed higher at 4.2284 on Aug’25 vs 4.374 on Jul’25.
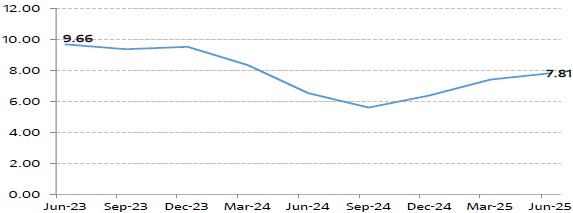
India GDP Growth Rate
India’s GDP grows 7.81% for Q1 FY26 vs 7.38% for Q4 FY25, The robust GDP growth was led by a sharp growth in the manufacturing sector and strong momentum in the services sector. India’s agricultural sector bounced back robustly with a 3.7% growth, manufacturing sector saw an impressive 7.7% growth, while construction grew at 7.6%. Services sector, which includes critical components like trade, hotels, and financial services, growth skyrocketed by 9.3%.