Economic Indicators (as on February 27, 2026)


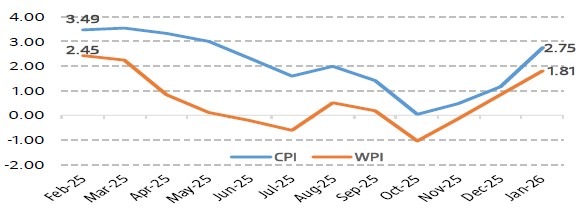
Inflation in India (%)

Consumer Price Index increased to 2.75% in Jan’26 from 1.17% in Dec’25, primarily driven by an increase in inflation of Vegetables, Egg, Meat and fish, Spices and Fuel and light. Wholesale Price Index (WPI) increased to 1.81% in Jan’26 from 0.83% in Dec’25 mainly drive by increased prices for basic metals, food articles, and textiles, reflecting rising input costs at the production level.

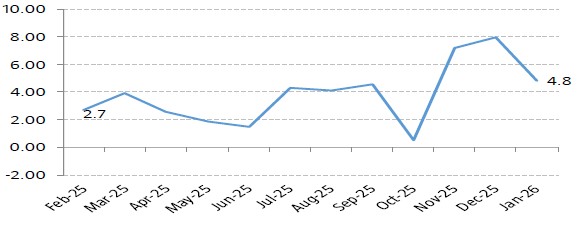
Index of Industrial Production (%)

Index of Industrial Production (IIP) slowed to a three-month low of 4.8% in Jan’26 from 8% in Dec’25. This deceleration was driven by slower manufacturing and consumer goods output, suggesting cooling in industrial activity after a period of accelerated production. Manufacturing grew by 4.8%, mining by 4.3%, and electricity by 5.1%.

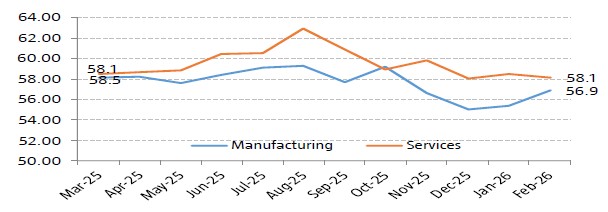
Indian Business Indicators - Purchasing Managers' Index (PMI)

S&P Global India Manufacturing Purchasing Managers’ Index (PMI) increases to 56.9 in Feb’26 from 55.4 in Jan’26 signaling robust expansion and a four-month high, driven by strong domestic demand and faster output growth. PMI Services marginally decreases to 58.1 in Feb’26 from 58.5 in Jan’26 though showing strong expansion despite mounting cost pressures and moderated domestic demand. The reading remains in the expansion zone, as a score above 50 indicates expansion, while a score below 50 denotes contraction.

USD INR & Brent Crude Movement

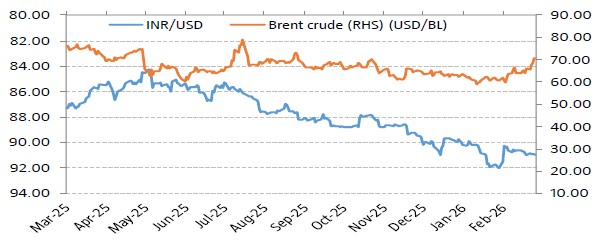
Brent crude oil increased sharply to US$ 72.48 on Feb’26 end from US$ 70.69 on Jan’26 as concerns about a potential military conflict between the U.S. and Iran exerted upward pressure on crude markets, amid fears of potential supply disruptions from the Middle East region. The Rupee closed the month on 90.9775 against Greenback as on Feb’26, reflecting continued volatility in global currency markets.

Equity Markets - India & US

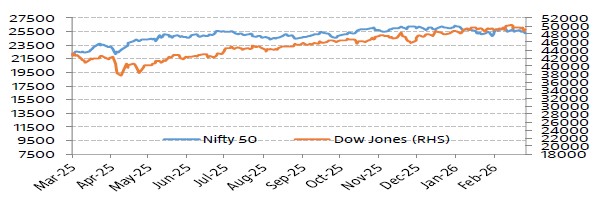
Bellwether indices, Nifty 50 and BSE Sensex decreased marginally during the month by 0.56% and 1.19% respectively amid increase in crude oil prices coupled with weakness in the rupee and rising tensions between the U.S. and Iran. Worries about disruptions related to artificial intelligence also kept investors on the edge. Foreign Institutional Investors (FIIs) were net buyers in Indian equities to the tune of ` 22,614.65 crore. Gross Goods and Services Tax (GST) collections in February 2026 stood at Rs. 1.83 trillion, representing a 8.1% rise on a yearly basis and this points towards the growing trajectory of the Indian economy. Dow Jones increased by 1.73% from previous month.
Interest Rate Movement (%) - India & US

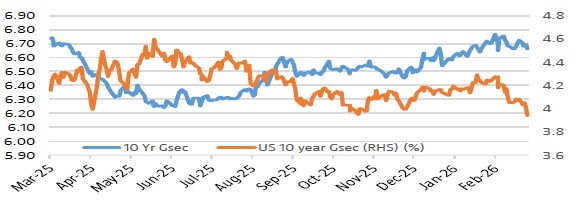
Yield on the 10-Year benchmark paper marginally decreased, closing at 6.66% on Feb’26 vs 6.696% on Jan’26 after a strong response at the weekly state debt auction. Indian states collectively raised Rs. 46,100 crore through bond sales, surpassing the planned issuance of Rs. 44,550 crore and indicating robust investor demand. US 10 year G-Sec closed lower at 3.9375 on Feb’26 vs 4.2355 on Jan’26.
India GDP Growth Rate

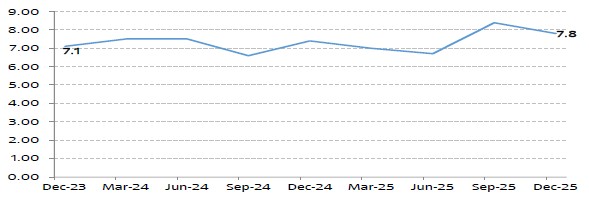
India’s GDP grew 7.8% for Q3 FY26 vs 8.23% for Q2 FY26, indicating a marginal moderation in economic growth during the quarter. On the sectoral front, the growth of Manufacturing sector rose to 13.3% in Q3 of FY26 from 10.8% in the same quarter of the previous fiscal year, supported by improved industrial activity and production levels. The growth of Agriculture, Livestock, Forestry & Fishing slowed to 1.4% in Q3 of FY26 compared to 5.8% rise in Q3 of FY25, reflecting weaker output in the agricultural sector during the period.
Note : The data/statistics are given to explain general market trends, it should not be construed as any research report/research recommendation. The sector(s) mentioned are for the purpose of understanding only and the Fundmayormaynot have any future position in these sector(s).
Source: Bloomberg