Economic Indicators (as on April 30, 2026)


Inflation in India (%)

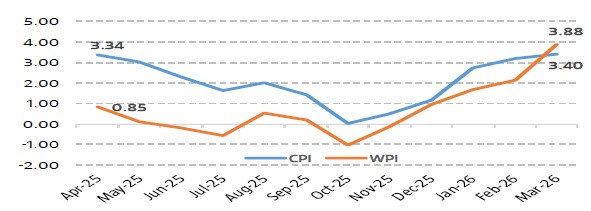
Consumer Price Index increased to 12-months high of 3.40% in Mar’26 from 3.21% in Feb’26, primarily driven up by inflation in the precious metal jewllery and specific food categories with expectations of higher energy prices gradually percolating over the next few months due to possibility of lag in arrival of replacement supplies. Wholesale Price Index (WPI) increased for the 5th straight month to 38-months high of 3.88% in Mar’26 from 2.13% in Feb’26 primarily driven by higher prices of crude petroleum & natural gas, manufactured products, non-food articles, and basic metals, indicating a broad-based uptick in wholesale price pressures.
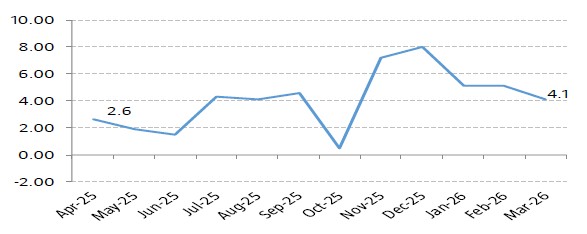
Index of Industrial Production (%)

Index of Industrial Production (IIP) decreased to 5-months low of 4.1% in Mar’26 from 5.2% in Feb’26 on subdued manufacturing,activity and lack of expansion in the power sector. Manufacturing grew by 4.3% and mining by 5.5%, while electricity generation only rose by 0.8%.
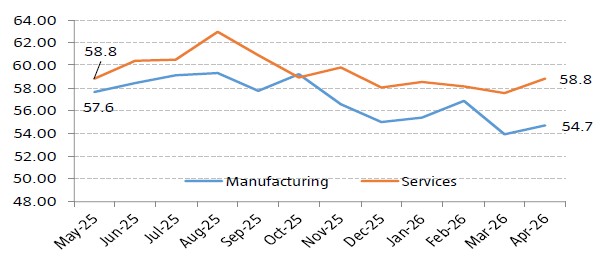
Indian Business Indicators - Purchasing Managers' Index (PMI)

S&P Global India Manufacturing Purchasing Managers’ Index (PMI) rose to 54.7 in Apr’26 from 53.9 in Mar’26 supported by moderate increases in output, new orders, including export demand and employment levels. PMI Services also increased to 5 month high of 58.8 in Apr’26 from 57.5 in Mar’26 despite slowdown in international sales growth. The reading remains in the expansion zone, as a score above 50 indicates expansion, while a score below 50 denotes contraction.

USD INR & Brent Crude Movement

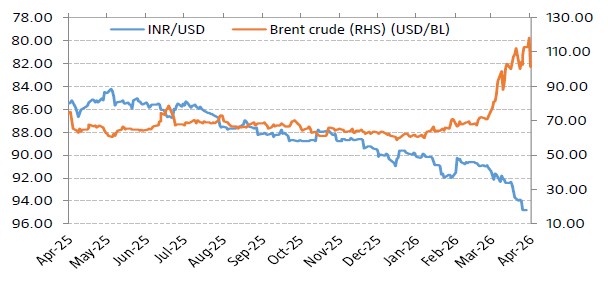
Brent crude oil moderatly decreased to US$ 114.01 in Apr’26 end from US$ 118.35 on Mar’26 as risks of output and supply disruptions dampened expectations of a resumption in export flows through U.S.-led diplomacy, following Iran’s hardening stance in peace talks. The Rupee closed the month on 94.92 against Greenback as on Apr’26, reflecting continued volatility in global currency markets.

Equity Markets - India & US

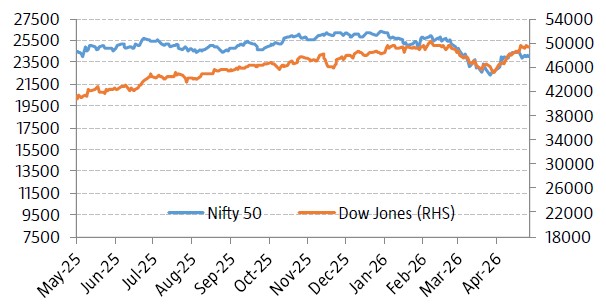
Bellwether indices, Nifty 50 and BSE Sensex increased drastically during the month by 7.46% and 6.90% respectively driven by improved global risk sentiment after the U.S. and Iran announced a 2-week ceasefire and Iran proposing to reopen the Strait of Hormuz and easing the conflict. This development led to a pullback in the dollar and a decline in crude oil prices from recent highs, easing concerns over potential supply disruptions in the region’s critical energy corridor. Foreign Institutional Investors (FIIs) were net sellers in Indian equities to the tune of ₹ 60,847.25 crore. Net Goods and Services Tax (GST) collections in Apr’26 stood at Rs. 2.43 trillion, representing a 8.7% rise on a yearly basis due to robust revenue from imports. Dow Jones increased by 7.14% from previous month.

Interest Rate Movement (%) - India & US

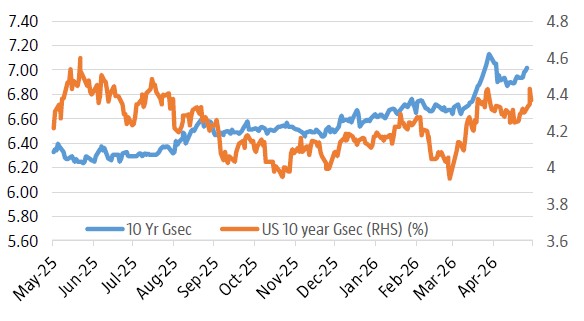
Yield on the 10-Year benchmark paper slightly decreased, closing at 7.015% on Apr’26 vs 7.035% on Mar’26 narrowing the yield differential between Indian and Global Bonds. This is reflecting market concerns over outflow of Foreign capital and combination of rising crude oil prices and global headwinds. US 10 year G-Sec closed higher at 4.3706% on Apr’26 vs 4.3166% on Mar’26 .


Note : The data/statistics are given to explain general market trends, it should not be construed as any research report/research recommendation. The sector(s) mentioned are for the purpose of understanding only and the Fundmayormaynot have any future position in these sector(s).
Source: Bloomberg